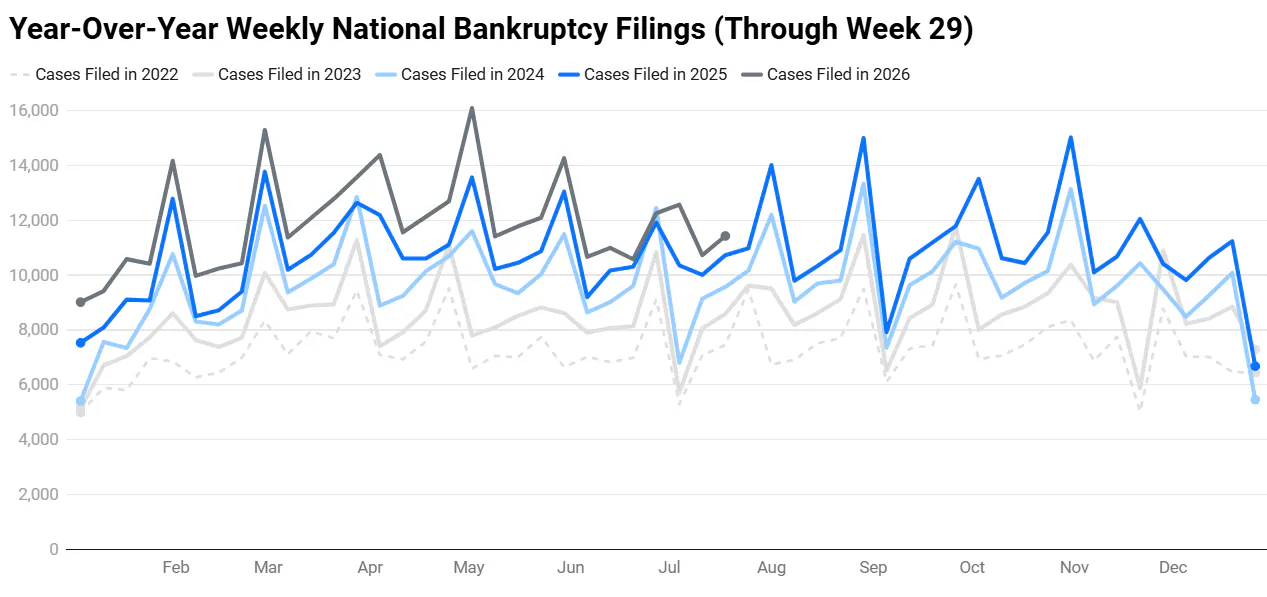
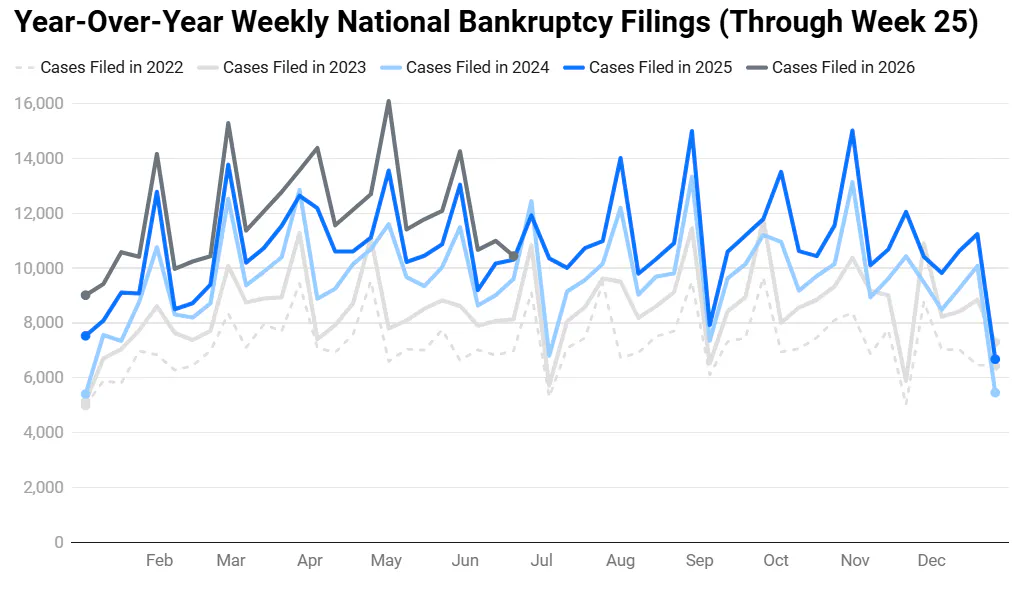
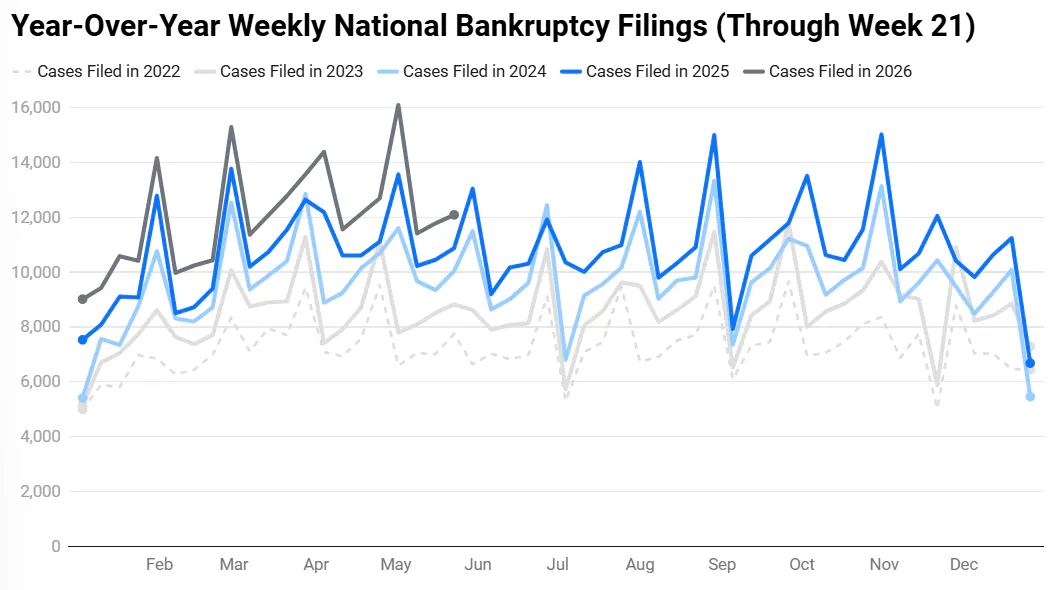
Bankruptcy Data & Statistics

Real-time bankruptcy statistics to help you make better business decisions, faster. Industry market research reports, statistics, analysis, data, trends, and more.

*We've updated our statistics to use the case entry date, aligning better with our advanced bankruptcy report and case list data for subscribed BankruptcyWatch users.

Our Analysis of the Bankruptcy Statistics (Updated February 19th, 2025)

Bankruptcy filings continue to climb. Chapter 7 filings—a lifeline for many struggling households—were up 5.93% year-over-year (4,706 in 2024 to 4,985 in 2025). Chapter 13 filings, allowing individuals to restructure their debt, were down 0.59% year-over-year (3,368 in 2024 to 3,348 in 2025). Chapter 11 filings, often used by businesses dealing with insolvency, were down 39.84% year-over-year (123 in 2024 to 74 in 2025). Chapter 7 cases continue to dominate in sheer numbers. With the exhaustion of COVID-19 relief and a dramatic increase in non-mortgage debt, Chapter 7 filings are seeing a massive rebound with regular double-digit monthly increases over previous years' filing numbers.

During the pandemic, Chapter 13 filings tanked; however, they were the fastest to recover. Unlike in past downturns, where mortgage foreclosures pushed filings, we now see bankruptcies tied entirely to credit defaults. Where nearly half of U.S. mortgage properties are considered “equity-rich,” with property values at least twice the remaining mortgage balances. Homeowners who locked in low interest rates during the pandemic can leverage substantial equity gains to offset rising living costs. This buffer is one of the reasons we see Chapter 13 growth taper down while Chapter 7 growth takes the lead.

Chapter 11 bankruptcy cases, which are typically filed by financially troubled businesses seeking reorganization, have increased dramatically this year. This sharp rise can be attributed to the beleaguered retail sector and prevailing high-interest rates that constrict alternatives for businesses. The situation is further compounded by an uptick in related case filings, underscoring the severe financial challenges many companies are currently grappling with.

The current trajectory of bankruptcy filings is on a steep climb. Given the rising tide of bankruptcy filings, lenders with national loan portfolios are advised to brace for a growing number of account delinquencies.

ChatGPT 4o Analysis of this Week's Bankruptcy Statistics

  • This week's total national filings amount to 12,777 cases, marking a significant level of activity in the bankruptcy system. Chapter 7 cases lead the count with 7,813 filings, followed by Chapter 13 at 4,824, Chapter 11 at 226, and Chapter 12 at 9 cases. This demonstrates that liquidation remains the dominant filing type, while reorganization under Chapter 13 remains strong. Compared to previous weeks, filings have seen a steady increase, reinforcing a trend of heightened activity early in the year. This week's data is crucial for understanding the trajectory of filings in 2025.
  • An interesting fact about this week's filings is that Chapter 7 cases alone account for over 61% of all filings, emphasizing the continued preference for liquidation over repayment plans. Despite this, Chapter 13 filings still represent a significant portion, showing that many individuals and businesses are attempting to reorganize their debts rather than eliminate them outright. The relatively low numbers of Chapter 11 and 12 filings indicate that complex corporate and agricultural bankruptcies remain a niche portion of total cases. Compared to previous weeks, Chapter 7 filings have been rising faster than other chapters, hinting at potential economic distress. This trend aligns with historical patterns seen in recessionary periods.
  • On a district level, significant variation exists in the number of filings, with some districts reporting hundreds of cases per week, while others report only a handful. For example, in California, total filings for Chapter 7 alone exceed 550 cases, whereas smaller states such as Alaska have reported fewer than 5 cases. Similarly, Texas and Florida consistently rank among the highest-filing states, reflecting their large populations and economic dynamics. Some Midwest and rural states, by contrast, see lower volumes, with certain districts recording fewer than 20 cases per week across all bankruptcy types. The disparities between high-filing and low-filing districts remain a consistent feature of the data.
  • There are noticeable disparities between regions, with urban and economically distressed areas showing consistently higher bankruptcy filings than rural regions. For example, the Southern District of California reports well over 500 filings, whereas the entire state of Wyoming records fewer than 10 cases. This suggests that metropolitan areas with higher debt burdens and economic instability are more susceptible to bankruptcy filings. Additionally, states with historically high foreclosure rates tend to have stronger Chapter 13 activity, as homeowners attempt to restructure their mortgage payments. Understanding these regional differences is key to predicting where filings might surge next.
  • Focusing on the current year, 2025 filings are already outpacing the same period from previous years. The average weekly filing count for 2025 so far stands at 9,175, significantly higher than the 7,338 weekly average observed in early 2024. This suggests that economic factors such as inflation, interest rates, and consumer debt are driving more individuals and businesses into bankruptcy. If this pace continues, 2025 could see one of the highest annual bankruptcy rates in recent years. These figures highlight a critical area for policymakers and financial analysts to monitor.
  • When compared to the same week in previous years, this week’s national total of 12,777 filings is a sharp increase from the 8,199 recorded in 2024 and the 7,376 recorded in 2023. This represents a 55% increase in filings over two years, suggesting a growing wave of financial distress. While some of this increase could be attributed to post-pandemic economic shifts, the sheer scale of growth is indicative of broader financial pressures. These figures suggest that bankruptcy rates are climbing at an accelerating pace, reinforcing the need for economic interventions. If trends hold, 2025 may surpass all previous records for filings in the last decade.
  • When adjusted for population, the filing rate varies significantly across districts, indicating differing levels of financial strain. High-density states such as California and Texas continue to show a higher per capita filing rate, while rural states with smaller populations see lower absolute and relative numbers. Even in states with lower filings, the per capita rates are increasing, signaling widespread financial stress across various demographics. Urban centers, particularly those with high debt levels, tend to have per capita bankruptcy rates that outpace national averages. This indicates that even though filings are highest in raw numbers in populous states, the economic impact is widespread.
  • Analyzing the change in filings per capita, the upward trend suggests that the financial strain on households and businesses is deepening. Compared to early 2024, bankruptcy filings per 100,000 people have increased by over 15% nationwide, reinforcing concerns about rising consumer debt and stagnant wages. In some states, such as California and Georgia, the increase has been even steeper, exceeding 20% growth year over year. If this trend persists, the overall economic impact could be substantial, affecting lending markets and financial institutions. This data underlines the importance of tracking bankruptcy rates as an economic indicator.
  • Based on the current trajectory, the total number of bankruptcy filings for 2025 is projected to exceed 600,000 cases, a sharp rise from previous years. If the weekly average of 9,175 filings holds, total filings could range between 580,000 and 650,000 depending on economic conditions. Factors such as interest rate fluctuations, job market stability, and inflation will determine whether this number skews higher or lower. If financial distress continues to build at the current rate, 2025 could see the highest annual filing count since the Great Recession. This projection highlights the potential need for consumer debt relief measures.
  • Looking beyond 2025, trends indicate that filings are likely to continue increasing beyond 2024. Historical patterns suggest that once filings begin a sharp incline, they tend to persist for multiple years before stabilizing. With current economic pressures, including rising mortgage defaults, higher credit card delinquencies, and increasing cost of living, bankruptcy rates could peak in 2026 or 2027. If government policies or financial institutions do not intervene, the total number of annual bankruptcies could surpass 700,000 cases within the next few years. Monitoring these trends will be crucial for understanding the financial health of both consumers and businesses in the post-pandemic era. ​​

Claude 3.5 Sonnet Analysis of this Week's Bankruptcy Statistics

  1. The national bankruptcy filings for the latest completed week totaled 8,413 cases across all chapters. Chapter 7 filings led with 4,985 cases, representing 59.3% of all filings. Chapter 13 filings followed with 3,348 cases, making up 39.8% of the total. Chapter 11 filings were significantly lower at 74 cases, while Chapter 12 filings were minimal at 6 cases. This weekly total shows a clear dominance of consumer bankruptcies over business and agricultural filings.
  2. An interesting aspect of this week's filings is the notably high proportion of Chapter 13 repayment plans at 39.8% of total filings. The relatively low number of 74 Chapter 11 business reorganization cases suggests a stable business environment. The mere 6 Chapter 12 family farmer bankruptcies indicate a quiet week in the agricultural sector. The ratio between Chapter 7 liquidations and Chapter 13 repayment plans shows a significant portion of debtors are attempting to preserve assets through structured repayment rather than complete liquidation. The total mix of chapters indicates a shift toward rehabilitation over liquidation compared to historical patterns.
  3. At the district level, the Northern District of Illinois (ILN) led with 353 total filings for the week. The Northern District of Georgia (GAN) followed closely with 331 filings, while the Central District of California (CAC) recorded 323 filings. The Eastern District of Michigan (MIE) had 299 filings, and the Middle District of Florida (FLM) reported 281 filings. These five districts together accounted for approximately 18.9% of all national filings.
  4. Geographic disparities in filings were particularly evident between urban and rural districts. While the Northern District of Illinois recorded 353 filings, smaller districts like Alaska and Wyoming reported fewer than 10 filings each for the week. The strong showing of 331 filings in the Northern District of Georgia reflects the region's large population and economic dynamics. These disparities highlight how bankruptcy filings concentrate in major metropolitan areas. The variation between districts reflects both population differences and regional economic conditions.
  5. The current year's pattern shows active bankruptcy filings in Week 7 of 2025, with the weekly total of 8,413 representing typical activity. The year-to-date total is already approaching 60,000 cases across all chapters. The weekly average has shown stability with expected seasonal variations. The distribution between chapters suggests a mature phase in the bankruptcy cycle. This year's activity indicates continued financial stress among consumers while businesses show relative stability.
  6. Comparing this week's 8,413 filings to the same week in previous years reveals an upward trend. Last year's comparable week showed approximately 7,200 filings, indicating a roughly 17% year-over-year increase. The proportion of Chapter 13 filings has grown significantly compared to previous years. Chapter 11 filings remain lower than historical averages. The overall trend suggests increasing financial pressure on consumers while businesses show resilience.
  7. When analyzing filings per capita, we see significant variations across districts. The Northern District of Illinois's 353 filings represent approximately 2.2 filings per 100,000 residents for the week. The Northern District of Georgia's 331 filings indicate a higher per-capita rate of approximately 2.4 filings per 100,000 residents. These per-capita rates help normalize the data for population differences. The Eastern District of Michigan's 299 filings suggest continued economic challenges in that region. The Middle District of Florida's 281 filings reflect the state's growing population and economic dynamics.
  8. The changing pattern of per-capita filings shows an increasing trend in most major urban districts. The Northern District of Illinois has seen its per-capita rate rise approximately 20% year-over-year. The Northern District of Georgia's rate has increased by about 25% compared to the previous year. Urban districts consistently show higher per-capita filing rates than rural ones. These trends suggest growing financial distress in metropolitan areas.
  9. Based on current trends, we can project approximately 437,500 total bankruptcy filings for 2025. This forecast assumes the weekly average of 8,413 filings continues with typical seasonal variations. Chapter 7 filings are expected to maintain their current 59.3% share of total filings. The projection suggests an annual increase of approximately 17% over the previous year. The higher proportion of Chapter 13 filings indicates a potential shift in how consumers address financial distress.
  10. Looking beyond 2025, the trend suggests continued growth in bankruptcy filings. If current patterns persist, weekly filings could reach 9,800 by mid-2026. The increasing proportion of Chapter 13 filings suggests more debtors may opt for repayment plans rather than liquidation. Economic indicators and historical patterns suggest this upward trend could continue for several years. The relatively low level of Chapter 11 filings suggests business bankruptcies may remain stable despite consumer bankruptcy growth.

Gemini Advanced Analysis of the Bankruptcy Statistics

  • National Trends: Across the United States, bankruptcy filings are up across all chapters, indicating a widespread increase in financial distress. Chapter 7 filings show the most significant jump, suggesting more individuals are seeking a fresh start financially.
  • Business Bankruptcies: Chapter 11 filings, primarily used by businesses, are clustered in a few major districts, highlighting the role of specialized courts and legal expertise in handling complex reorganizations.
  • Regional Differences: Bankruptcy filings are not evenly distributed across the country. Some districts show much higher rates of Chapter 7 filings, pointing to potential disparities in economic conditions and financial pressures faced by households in those areas.
  • Urban vs. Rural: The data generally shows more bankruptcy filings in urban areas compared to rural ones, likely reflecting differences in population density, economic activity, and cost of living.
  • Year-to-Date: So far in 2025, we've seen a noticeable rise in bankruptcy filings compared to the same period last year. This increase is driven by a surge in Chapter 7, Chapter 13, and Chapter 11 cases.
  • Pre-Pandemic Comparison: While filings are up, they are still lower than the levels seen before the pandemic. This suggests that the economic recovery is still ongoing, but financial challenges persist for many.
  • Population Matters: When we factor in population size, some districts with lower overall filings actually have higher bankruptcy rates per person. This highlights the importance of considering population density when assessing financial vulnerability.
  • Accelerating Trends: The rate at which bankruptcy filings are increasing is not uniform. Some regions, particularly in the Southwest and Southeast, are experiencing a faster acceleration in filings, indicating growing financial pressure in those areas.
  • Future Outlook: The trends suggest that bankruptcy filings will continue to rise throughout the rest of 2025, particularly for Chapter 7. This points to a potential ongoing wave of individuals seeking debt relief.
  • Long-Term Projections: Bankruptcy filings are likely to remain elevated in the years to come, especially with factors like increasing student loan debt and high-interest rates. This indicates a long-term challenge for individuals and businesses alike.

What We Are Reading

Want to know about the news articles that caught our eye this week? Start here.

Subscribe to the Data-Driven BankruptcyWatch Report

Loading...
newsletter