📢 The BNC is back. Don't let one outage blind your team again.Request a Demo

Weekly Update

2026 Week 43 Bankruptcy Statistics: Business Filings Up 38% YoY

Marco Varela

Marco Varela

Marco Varela

October 26, 20265 minute read

*We've updated our statistics to use the case entry date, aligning better with our advanced bankruptcy report and case list data for subscribed BankruptcyWatch users.

Our Analysis of Week 43 Bankruptcy Filing Statistics by Chapter (Updated October 19th, 2026)

Week 43 showed a divergence between consumer and business trends, with consumer bankruptcies remaining essentially flat, declining less than 1% to 11,407 filings, while business filings surged roughly 38% to 168 cases compared with the same week last year.

Chapter 7 filings, a lifeline for many struggling households, were down 2.56% year-over-year (7,428 in 2025 to 7,238 in 2026). Chapter 13 filings, allowing individuals to restructure their debt, were up 4.04% year-over-year (4,007 in 2025 to 4,169 in 2026). Chapter 11 filings, often used by businesses facing insolvency, were up 41.03% year-over-year (117 in 2025 to 165 in 2026).

AI Analysis of 2026 Week 43 Bankruptcy Filing Data

We exported our dataset containing the daily filing numbers for every chapter and district to different AI models and asked for an analysis. Below are the exact results for each model.

Claude Opus 4.7 Extra Analysis of Week 43 Bankruptcy Filings

  1. Overview of this week’s National filings. For the week of October 26, the country recorded 11,575 total bankruptcy filings, the highest week-43 figure in the entire five-year span of the dataset, though only barely edging out 2025’s 11,557. Chapter 7 liquidations made up 7,238 filings during week 43, or roughly 62.5% of the national total, while Chapter 13 wage-earner reorganizations contributed 4,169 filings, about 36.0%. Chapter 11 business reorganizations added 165 filings and Chapter 12 farm filings totaled just 3, together accounting for about 1.5% of week 43 activity. Week-over-week, total filings rose 7.4% from week 42’s 10,777, moving back toward the 2026 year-to-date weekly average of 11,973. Year-over-year, week 43 of 2026 is essentially flat compared with the same week in 2025, posting just a 0.2% gain versus the prior year’s 11,557 — the slowest YoY reading in all of 2026.
  2. An interesting fact about this week’s filings. The most striking detail about the week of October 26 is the unusual Chapter 11 business filing cluster in the Eastern District of Virginia, which produced 24 Chapter 11 filings — the first time EDVA has topped the national Chapter 11 ranking in 2026. The Eastern District of New York added 18 Chapter 11 filings and the Southern District of Texas chipped in 13, together giving these three venues over one-third of the week’s 165 Chapter 11 activity. The Eastern District of Virginia’s cluster also lifted its combined weekly total to 324 across all chapters, giving the district its highest-ever national ranking of 2026 at sixth place. Chapter 12 farm filings collapsed to just 3 nationwide, with one filing each in the Northern District of Georgia, Minnesota, and South Dakota. Year-over-year, Chapter 11 grew a striking 41.0% (from 117 to 165) while Chapter 7 fell 2.6% and Chapter 12 dropped 40.0%, showing a sharp divergence between commercial restructuring and consumer or farm filings.
  3. An overview of this week’s district-level filings with reference to actual district filing numbers. Combining all four chapters during the week of October 26, the Middle District of Florida led the country with 604 filings, followed by the Central District of California at 576, the Northern District of Illinois at 458, and the Northern District of Georgia at 396. The Eastern District of Michigan recorded 350 total filings during week 43, the Eastern District of Virginia 324, Arizona 304, the Southern District of Florida 284, the Northern District of Ohio 279, and Maryland 268. Looking at Chapter 7 alone, the Middle District of Florida posted 490, the Central District of California 483, the Northern District of Illinois 248, the Northern District of Georgia 243, Arizona 235, the Northern District of Ohio 227, the Eastern District of Michigan 226, the Eastern District of California 204, the Eastern District of Virginia 186, and the Southern District of Ohio 175. On the Chapter 13 side, the Northern District of Illinois led with 207, followed by the Northern District of Georgia at 150, the Northern District of Alabama at 135, the Western District of Tennessee at 129, the Eastern District of Michigan at 123, the Eastern District of Virginia at 114, the Southern District of Florida at 113, the Middle District of Alabama at 110, the Middle District of Florida at 105, and New Jersey at 101. The top ten districts during week 43 together produced about 3,843 filings, accounting for roughly 33.2% of the 11,575-filing national total.
  4. Geographic (district) disparities in filings. The disparity between busy and quiet districts during week 43 remained enormous: while the Middle District of Florida posted 604 total filings, the Northern Mariana Islands and the Virgin Islands each recorded zero, with Guam at just 1. Other very low-volume districts during the week of October 26 included Alaska at 4, both Vermont and the Southern District of West Virginia at 12 each, Montana at 13, and South Dakota, the Northern District of Iowa, and the Northern District of West Virginia tied at 14 each. The Eastern District of Virginia climbed to 324 total filings on the back of its 24-filing Chapter 11 cluster, illustrating how a single restructuring wave can briefly reshape district rankings. The southeastern Sun Belt and major metro districts of California, Illinois, Michigan, and Ohio dominated the overall leaderboard for week 43. This pattern of concentration is structural, reflecting population, regional economic stress, and entrenched filing behaviors rather than any one-week anomaly.
  5. Current year focus. Through the first 43 weeks of 2026, the country has logged 514,840 total filings, an average of 11,973 per week and comfortably ahead of every prior year in the dataset at the same point on the calendar. The year began softer at 9,012 in week 1 but has trended firmly upward, with notable peaks of 14,157 in week 5, 15,290 in week 9, 14,380 in week 14, 16,091 in week 18, 14,259 in week 22, 12,569 in week 27, 15,891 in week 31, and 15,162 in week 40, with the week of October 26 settling at 11,575. Chapter 7 rose to 7,238 during week 43 (up from 6,640 the prior week), while Chapter 13 climbed to 4,169 (up from 4,036). Chapter 11 jumped to 165 in week 43 from just 96 the prior week on the back of the Virginia cluster, and Chapter 12 slipped to 3 from 5. The overall pattern for 2026 is a clearly higher baseline than any earlier year covered by the dataset, with year-to-date volume now firmly on track to finish the year around 620,000 filings.
  6. Comparative analysis with previous years. Looking at the same week 43 across years yields a steady climb: 8,109 in 2022, 9,336 in 2023, 10,148 in 2024, 11,557 in 2025, and 11,575 in 2026 — a cumulative increase of about 42.7% over the four-year span. Annual growth rates for week 43 specifically were 15.1% (2023), 8.7% (2024), 13.9% (2025), and essentially flat at 0.2% (2026), marking the slowest YoY reading of 2026 to date. The same upward trend appears in year-to-date totals through week 43: 314,589 in 2022, 367,092 in 2023, 418,921 in 2024, 466,032 in 2025, and 514,840 in 2026. That means 2026 is running about 10.5% ahead of 2025’s pace at the same point on the calendar and roughly 63.7% ahead of where 2022 stood after 43 weeks. The combination of a nearly flat week-of-October-26 year-over-year reading against a still-strong year-to-date lead suggests the pace of growth is moderating meaningfully as 2025’s higher comparison base takes hold.
  7. Analyzing the filings per capita. Per-capita filing pressure varies dramatically across districts even after controlling for population. During week 43, the Central District of California, with roughly 20 million residents, produced 576 total filings — about 29 per million residents. The Northern District of Georgia, with around 6.5 million residents, produced 396 filings during the week of October 26, which works out to roughly 61 per million, more than double Southern California’s per-capita rate. The Western District of Tennessee (129 Chapter 13 filings) and the Northern District of Alabama (135 Chapter 13 filings) sit even higher on a per-resident basis, while the Middle District of Florida’s 604 combined filings translate to roughly 57 per million given its 10.6-million population. Adjusted for population, the heaviest filing pressure during week 43 clearly concentrates across the southeastern Sun Belt rather than in the largest absolute-volume coastal metros.
  8. Analyzing the changing filings per capita. Because U.S. population has grown only roughly 0.5–0.6% per year while filings have risen 0–15% annually since 2022 at this point on the calendar, the per-capita filing rate has climbed sharply over the past four years. Nationally, week 43 of 2026’s 11,575 filings translate to about 34 per million residents, up from roughly 24 per million in week 43 of 2022 — an increase of about 43% in four years. Districts that were already filing-heavy have seen the steepest per-capita rises, especially the Middle District of Florida, whose 604 combined filings during the week of October 26 represent a substantial step-up from typical week-43 totals in the mid-300s back in 2022. In contrast, the lowest-filing jurisdictions during week 43 (Alaska at 4, Vermont and Southern District of West Virginia at 12 each, Montana at 13, South Dakota and Northern District of Iowa and Northern District of West Virginia at 14 each) remain essentially flat in per-capita terms and very low in absolute terms. The widening per-capita gap means financial distress is becoming more geographically concentrated rather than more evenly distributed year after year.
  9. Forecast the expected filing numbers for the rest of the year. With 514,840 filings already logged through week 43, if the rest of 2026 follows 2025’s seasonal pattern, the remaining 9 weeks (weeks 44 through 52) should produce roughly 107,000 additional filings, putting the full year near 622,000 total filings compared with 562,656 in 2025. Using the year-to-date 2026 weekly average of 11,973 applied to the remaining 9 weeks yields a projection of about 108,000 more filings and a year-end total around 623,000. A more conservative scenario that accounts for the typical late-year holiday slowdown (week 52 of 2025 dropped to just 6,678) would land closer to 615,000–630,000. Taken together, the most likely 2026 year-end range is approximately 615,000 to 635,000 total filings, with the central estimate near 622,000. That would represent roughly 9–13% growth over 2025’s full-year total of 562,656.
  10. Forecast the trends of increasing filings after 2025. The four-year trajectory of full-year totals (378,337 in 2022, 445,209 in 2023, 503,793 in 2024, 562,656 in 2025, and a projected ~622,000 in 2026) implies a compound annual growth rate of about 14% from 2022 through 2025, easing to roughly 11% in 2026. If the near-flat week-of-October-26 year-over-year figure (0.2%) signals a sustained slowdown rather than a one-week dip, annual increases could moderate to about 3–5% in 2027 and 2–4% in 2028, putting filings into the 640,000–670,000 range by 2027 and the 655,000–695,000 range by 2028. The chapter mix is also likely to keep shifting: Chapter 11 grew 41.0% year-over-year during week 43 (from 117 to 165) driven by the Virginia cluster, while Chapter 13 rose 4.0% (from 4,007 to 4,169), Chapter 7 slipped 2.6% (from 7,428 to 7,238), and Chapter 12 fell 40.0% (from 5 to 3). Chapter 13, propelled by southeastern Sun Belt districts that produced 207, 150, 135, 129, 123, 114, 113, 110, 105, and 101 filings during the week of October 26 alone, is likely to retain its steady 32–37% share of the national total. The biggest risk to this baseline remains a recession, credit-tightening shock, or commercial real estate crisis — any of which could push 2027 filings well above the smoothed projection rather than modestly below it.

ChatGPT 5.5 Thinking Pro Analysis of Week 43 Filing Trends

For week 43, beginning Monday, October 26, 2026, national bankruptcy filings totaled 11,575. Chapter 7 accounted for 7,238 filings, Chapter 13 accounted for 4,169, Chapter 11 accounted for 165, and Chapter 12 accounted for 3. The national total was 798 filings higher than week 42’s 10,777, a 7.4% increase. Compared with week 43 of 2025, when there were 11,557 filings, this week was higher by just 18 filings, or 0.2%. Through week 43 of 2026, national filings reached 514,840.

One interesting feature of week 43 was that national filings increased across three of the four bankruptcy chapters. Chapter 7 rose by 598 filings, moving from 6,640 in week 42 to 7,238 in week 43. Chapter 13 also increased by 133 filings, rising from 4,036 to 4,169. Chapter 11 climbed from 96 to 165 filings, while Chapter 12 declined slightly from 5 to 3. Together, Chapters 7 and 13 accounted for 11,407 filings, representing 98.5% of the national total of 11,575.

At the district level, week 43 was led by Middle Florida with 604 filings. Central California followed with 576 filings, Northern Illinois had 458, Northern Georgia had 396, and Eastern Michigan had 350. Eastern Virginia reported 324 filings, Arizona had 304, Southern Florida had 284, Northern Ohio had 279, and Maryland had 268. The top 5 districts together produced 2,384 filings. Those 2,384 filings represented 20.6% of the national total of 11,575.

Geographic differences remained noticeable during week 43, beginning Monday, October 26, 2026. The average district reported 123.1 filings, while the median district recorded 95.5. Middle Florida’s 604 filings were approximately 6.3 times the median district total. There were 17 districts with at least 200 filings, including Central California at 576, Northern Illinois at 458, and Northern Georgia at 396. At the other end, 14 districts recorded 20 or fewer filings, including Guam at 1, Alaska at 4, Vermont at 12, and both the Northern Mariana Islands and Virgin Islands at 0.

The 2026 year-to-date picture continues to show national filings running ahead of the same point in 2025. Through week 43, national filings totaled 514,840 in 2026. At the same point in 2025, national filings totaled 466,032. That means 2026 was ahead by 48,808 filings, or 10.5%, through week 43. Year-to-date Chapter 7 filings reached 325,700, Chapter 13 reached 180,979, Chapter 11 reached 7,859, and Chapter 12 reached 302.

Week 43 of 2026 was higher than the same week in every previous year shown in the data, although the difference from 2025 was small. The comparable weekly totals were 8,109 in 2022, 9,336 in 2023, 10,148 in 2024, 11,557 in 2025, and 11,575 in 2026. This year’s week 43 total was 42.7% higher than 2022 and 24.0% higher than 2023. It was also 14.1% higher than 2024 but only 0.2% higher than 2025. Looking at the first 43 weeks of each year, 2026’s 514,840 filings were 95,919 higher than 2024’s 418,921.

A true per-capita bankruptcy filing rate cannot be calculated from the available weekly figures alone because district population counts are not included. However, comparing the average number of filings per district helps show how filing activity is distributed across the country. For week 43, the national total of 11,575 filings across 94 districts equals an average of 123.1 filings per district. The median district recorded 95.5 filings, which was 27.6 below the national district average. Middle Florida’s 604 filings were 4.9 times the district average, while Central California’s 576 filings were approximately 4.7 times that average.

Looking at changes in filing activity across districts, week 43 continues to reflect higher bankruptcy filings than earlier years. National filings increased from 8,109 in week 43 of 2022 to 11,575 during the same week of 2026, a gain of 3,466 filings. Across 94 districts, the average increased from 86.3 filings per district in 2022 to 123.1 in 2026. Compared with week 43 of 2025, the average increased only slightly, moving from 122.9 to 123.1 filings per district. This represents an increase of approximately 0.2 filings per district over the past year, suggesting that growth during this particular week has slowed even as the longer-term trend remains positive.

A simple forecast based on the 2026 year-to-date average of 11,973.0 filings per week points to approximately 622,597 filings for the full 52-week year. Since 514,840 filings had already occurred through week 43, maintaining that pace would add approximately 107,757 filings over the remaining 9 weeks. A second approach uses the 2025 weeks 44 through 52 total of 96,624 filings as a baseline. Increasing that remaining-year baseline by the current 10.5% year-to-date growth rate suggests approximately 106,744 additional filings. Together, these approaches suggest the rest of 2026 could add roughly 106,744 to 107,757 filings, bringing the projected annual total to approximately 621,584 to 622,597.

The longer-term trend after 2025 remains upward, although week 43 shows that year-over-year growth is not equally strong every week. Week 43 of 2026 recorded 11,575 filings, compared with 11,557 during the same week in 2025, an increase of just 0.2%. Through week 43, national filings reached 514,840, compared with 466,032 in 2025, representing a stronger year-to-date increase of 10.5%. The full-year weekly average rose from 7,275.7 in 2022 to 8,561.7 in 2023, 9,688.3 in 2024, and 10,820.3 in 2025. If the current 2026 average of 11,973.0 filings per week continues, it would represent approximately 1,152.7 additional filings per week compared with 2025, supporting expectations of higher annual bankruptcy filings despite occasional slower weeks.


Claude Sonnet 4.6 Analysis of Week 43 Bankruptcy Statistics

  1. Overview of This Week’s National Filings The week ending October 26, 2026 produced 11,575 federal bankruptcy filings across the United States — a healthy rebound from the prior week’s 10,777 and a reading that falls comfortably within the year’s established mid-range band. Chapter 7 liquidations led with 7,238 filings at 62.5% of the weekly total, while Chapter 13 wage-earner reorganizations contributed 4,169 cases at 36.0%. Chapter 11 commercial restructurings added 165 cases at 1.4%, bouncing back from last week’s unusually low 96, and three Chapter 12 agricultural filings rounded out the count. The week’s +7.4% gain over Week 42’s 10,777 aligns closely with the historical pattern for this calendar transition, which has produced gains in every prior year ranging from +4.5% to +10.7%. Week 43 is a normative, on-trend week that confirms the filing cycle has stabilized in the 11,000–12,000 range after the October 5 spike and subsequent pullback.
  2. An Interesting Fact About This Week’s Filings The most striking feature of Week 43 is how nearly identical it is to the same week in 2025: 11,575 filings in 2026 compared to 11,557 in 2025 — a difference of just 18 cases, or a +0.2% year-over-year margin that is the smallest weekly YoY gap of the entire year. For context, every other week of 2026 has exceeded its 2025 counterpart by at least 2%, and most weeks have posted YoY gains of 5% to 15% — making Week 43’s near-flat comparison genuinely exceptional rather than a sign of weakness. The explanation lies not with 2026 being soft — 11,575 is a perfectly normal reading — but with 2025’s Week 43 having been an unusually strong outlier that set a very high bar for this particular calendar week. Looking ahead, the historical Wk43-to-Wk44 transition is one of the most reliably bullish single-week moves in the autumn calendar: prior years saw gains of +3.1% in 2022, +11.2% in 2023, +29.4% in 2024, and +29.9% in 2025 — with the two most recent years producing near-30% surges that pushed Week 44 to 13,132 and 15,017 respectively. If 2026 follows either of those recent patterns, Week 44 could become the year’s second or third highest single-week reading.
  3. An Overview of This Week’s District-Level Filings Florida Middle reclaimed the top position in Week 43 with 604 filings — 5.2% of all national activity — followed by California Central at 576 (5.0%), Illinois Northern at 458 (4.0%), and Georgia Northern at 396 (3.4%). Michigan Eastern rounded out the top five at 350 (3.0%), making three of the top five districts Florida-Southeast corridor courts — a pattern that has persisted throughout 2026. Virginia Eastern was a notable presence at sixth place with 324 filings, including 24 Chapter 11 cases — the highest Chapter 11 count among individual districts this week and a reminder that the Washington-area court handles significant commercial restructuring activity. The mid-tier included Arizona (304), Florida Southern (284), Ohio Northern (279), Maryland (268), New Jersey (260), California Eastern (244), Ohio Southern (236), Texas Northern (227), and Alabama Northern (216). At the other end, Alaska posted only 4 filings, Guam registered 1, and the Northern Mariana Islands and Virgin Islands recorded no filings at all for the week.
  4. Geographic Disparities in Filings The ratio between the most and least active courts in Week 43 remains extreme: Florida Middle’s 604 filings is 151 times Alaska’s 4, a disparity that has characterized every week of 2026 and reflects the compounding of population size, regional debt levels, and local economic conditions on filing behavior. The top two districts, Florida Middle and California Central, together accounted for 1,180 filings — 10.2% of all national activity — from just two of 94 federal courts. The Southeast corridor’s structural dominance was again evident: Florida Middle, Florida Southern, Georgia Northern, Virginia Eastern, and Alabama Northern together contributed 1,824 filings, or 15.8% of the national total, from five geographically adjacent courts. Illinois Northern’s 458 filings, anchored by 207 Chapter 13 cases, made it the largest single-district contributor of consumer reorganization filings outside the Southeast — reflecting the sustained financial stress in the greater Chicago area that has consistently driven its high Chapter 13 share. The bottom tier of the national distribution — Montana (13), West Virginia Southern (12), Vermont (12), Alaska (4), Guam (1), and the territories at zero — collectively registered fewer than 50 filings, underscoring how little these jurisdictions move the national needle in any given week.
  5. Current Year Focus Through Week 43, cumulative 2026 filings stand at 514,840 — a total that has now surpassed 91.5% of 2025’s full-year figure of 562,656, with nine weeks still remaining. The comparable 2025 YTD through Week 43 was 466,032, meaning 2026 runs 10.5% ahead at this point — a gap that has compressed slightly from its recent peak of 11.2% as 2025’s autumn weeks were relatively strong. The weekly running average through Week 43 is 11,973 per week — essentially flat for the fifth consecutive week, reflecting a period of unusual stability in the year’s pace following the post-Labor Day redistribution. Chapter 7 YTD filings total 325,700 at 63.3%, Chapter 13 adds 180,979 at 35.2%, and Chapter 11 has reached 7,859 for the year — now 94.6% of 2025’s entire full-year Chapter 11 count of 8,307, meaning the annual Chapter 11 record will almost certainly be broken within the next two to three weeks. The 514,840 cumulative total provides a clear view of where the year is heading: 2026 will need to average just 5,313 filings per week over the remaining nine weeks to tie 2025, a bar it will clear at more than twice the required pace.
  6. Comparative Analysis With Previous Years Week 43’s 11,575 filings continued the unbroken five-year streak of setting a new annual high-water mark for this calendar week: the 2026 figure exceeds 2022’s 8,109 by +42.7%, 2023’s 9,336 by +24.0%, 2024’s 10,148 by +14.1%, and 2025’s 11,557 by +0.2%. That vanishingly thin margin over 2025 — just 18 cases — stands out against the prior three annual comparisons, all of which showed double-digit percentage gains; it reflects the high baseline that 2025 itself had established by this point in the calendar rather than any meaningful deceleration in 2026 demand. The YTD comparison remains more informative than any single-week reading: 2026’s 514,840 exceeds 2025’s 466,032 by 48,808 cases, a surplus that has been locked in the 48,000–49,000 range for several consecutive weeks. The four-year cumulative gain for Week 43 — from 8,109 in 2022 to 11,575 in 2026 — amounts to 3,466 additional filings per week at this same calendar milestone, an increase of 42.7% in absolute volume over four years. The multi-year trend for Week 43 remains unambiguously upward, with a pace of annual addition that shows no sign of plateauing.
  7. Analyzing the Filings Per Capita Adjusted for a 2026 U.S. population of 341 million, the running weekly average through Week 43 translates to 35.11 filings per million Americans per week — the fourth consecutive week in which the running rate has drifted slightly lower from its recent peak of 35.28, as the October pullback weeks continue to dilute the year’s cumulative average. Week 43 itself contributed 33.95 per million for the single week, a reading below the year’s running average but above the Labor Day trough and consistent with the normalized mid-autumn filing environment. The comparable per-capita rates through Week 43 for prior years were 21.97 per million in 2022, 25.48 in 2023, 28.91 in 2024, and 31.97 in 2025 — a staircase of consistent upward progression that 2026’s 35.11 extends by another full step. Across the four-year span from 2022 to 2026, the per-capita rate through Week 43 has risen by 13.14 per million — equivalent to adding the filing intensity of a mid-sized state to the national base over just four years. The recent softening of the running per-capita rate to 35.11 is a temporary arithmetic effect of several below-average weeks rather than a signal of any structural change, and the rate is likely to recover as soon as a stronger week is recorded.
  8. Analyzing the Changing Filings Per Capita The year-over-year per-capita increment through Week 43 stands at +3.14 per million — the difference between 2026’s 35.11 and 2025’s 31.97 at the same calendar point, and the lowest reading for this measure since early in the year. The drift from +3.31 in Week 40 to +3.14 in Week 43 reflects the confluence of two consecutive softer-than-average weeks in 2026 (Weeks 41 and 42) coinciding with a period where 2025’s comparable weeks — including 2025’s own strong Week 43 of 11,557 — were relatively elevated. The four-year series of annual per-capita increments remains in its established range: +3.51 from 2022 to 2023, +3.43 from 2023 to 2024, +3.06 from 2024 to 2025, and now +3.14 from 2025 to 2026 through Week 43. Whether the 2025-to-2026 increment ultimately settles at 3.0, 3.2, or 3.5 for the full year will depend significantly on the next nine weeks — and specifically on whether 2026’s Week 44 produces the same magnitude of surge that prior years have shown at this transition. The persistence of the increment within the 3.0–3.5 band across four annual transitions and 43 weeks of data in each year remains the strongest evidence that the bankruptcy normalization cycle is operating on a structural timetable rather than responding to any particular economic catalyst.
  9. Forecast the Expected Filing Numbers for the Rest of the Year With nine weeks remaining and 514,840 filings already recorded, the three projection methods are producing their most tightly clustered estimates of the entire year. The first method — averaging the most recent four weeks (Weeks 40 through 43, at 12,145 per week) and projecting that pace over nine remaining weeks — yields a full-year estimate of 624,145. The second method, extending the year’s full 43-week running average of 11,973 per week through year-end, produces 622,597. The third approach, applying the historical 3.5% second-half seasonal premium to the H1 weekly average of 11,932, generates an adjusted pace of 12,350 per week and a full-year projection of 625,988. All three methods now point to a year-over-year gain of 10.7%–11.3% over 2025’s 562,656 full-year total, with the spread among the three estimates narrowing to just 3,391 cases — the tightest convergence recorded since the series began. The consensus range of 622,600–626,000 is now almost certainly the correct landing zone for 2026 absent an extraordinary deviation in the final nine weeks.
  10. Forecast the Trends of Increasing Filings After 2025 The single most important forward-looking signal from Week 43’s data is the historical behavior of the Wk43-to-Wk44 transition, which has produced dramatically increasing gains in recent years: +3.1% in 2022, +11.2% in 2023, +29.4% in 2024, and +29.9% in 2025 — a progression that suggests Week 44 has become an increasingly significant spike week, potentially driven by end-of-October filing deadlines and seasonal patterns in consumer and commercial restructuring decisions. If 2026 follows the 2024–2025 template, Week 44 could deliver somewhere between 14,000 and 15,000 filings — which would push the YTD total above 528,000 and bring the year within roughly 34,000 filings of 2025’s full-year total with eight weeks still remaining. The Chapter 11 annual record deserves its own spotlight: at 7,859 YTD and with 2025’s full-year mark of 8,307 needing only 448 more cases to be surpassed, the new post-pandemic annual record for commercial restructurings is virtually certain to arrive before the end of the first week of November. Beyond 2026, extending the four-year per-capita increment of approximately +3.1 to +3.5 per million into 2027 would imply a full-year 2027 weekly average near 12,600 to 13,000, putting next year’s total on pace toward 655,000 to 675,000. The compound effect of four consecutive years of structural growth — with each year’s per-capita rate cleanly stepping above the last — paints a picture of a bankruptcy system accommodating a fundamentally larger share of American households and businesses than it did as recently as 2022.

ChatGPT 5.6 Sol Analysis of Week 43 District-Level Filing Data

  1. In week 43, beginning Monday, October 26, 2026, United States bankruptcy courts recorded 11,575 filings nationwide. Chapter 7 accounted for 7,238 cases, Chapter 13 for 4,169, Chapter 11 for 165, and Chapter 12 for 3. Compared with week 42’s 10,777 filings, the national total increased by 798 cases, or about 7.4%. Week 43 was still 570 filings below the recent four-week average of 12,145, a difference of about 4.7%. Overall, the week showed a solid rebound from October 19 without returning to the much higher 15,162 filings recorded in week 40.
  2. One interesting feature of week 43 is how closely the national total matched the same week last year. The 11,575 filings this year were only 18 higher than week 43 of 2025, when courts recorded 11,557, a difference of just 0.2%. Beneath that nearly flat total, Chapter 7 declined from 7,428 to 7,238, while Chapter 13 increased from 4,007 to 4,169. Chapter 11 also rose from 117 cases in 2025 to 165 this year, an increase of 48 cases. This shows that the overall filing count barely changed year over year even though the mix of cases shifted noticeably.
  3. District activity in week 43 was led by the Middle District of Florida with 604 filings, followed by the Central District of California with 576. The Northern District of Illinois recorded 458 cases, the Northern District of Georgia had 396, and the Eastern District of Michigan recorded 350. Together, those five districts generated 2,384 filings, representing about 20.6% of the national total. Compared with week 42, Northern Illinois increased by 43 cases, Middle Florida by 27, Northern Georgia by 25, and Central California by 5, while Eastern Michigan declined by 6. Those gains across several large districts helped support the national increase from 10,777 to 11,575 filings.
  4. Geographic differences remained substantial during week 43. The Northern Mariana Islands and Virgin Islands recorded 0 filings, while Guam recorded 1, Alaska 4, and both Vermont and the Southern District of West Virginia recorded 12. By comparison, the Middle District of Florida handled 604 cases, more than 151 times Alaska’s total. The five busiest districts produced 2,384 filings, while the Northern Mariana Islands, Virgin Islands, Guam, Alaska, and Vermont combined for only 17. With 11,575 filings nationwide, the numbers continue to show that bankruptcy activity is concentrated heavily in a relatively small group of higher-volume districts.
  5. Through week 43, United States courts have recorded 514,840 bankruptcy filings in 2026, compared with 466,032 through the same point in 2025. That difference of 48,808 filings represents year-to-date growth of approximately 10.5%. The average so far this year stands at about 11,973 filings per week, compared with approximately 10,838 during the first 43 weeks of 2025. Chapter 7 has reached 325,700 cases, Chapter 13 180,979, Chapter 11 7,859, and Chapter 12 302. Compared with 2025, those totals are higher by 32,106 Chapter 7 cases, 15,506 Chapter 13 cases, 1,137 Chapter 11 cases, and 59 Chapter 12 cases.
  6. Week 43’s 11,575 filings were only 18 higher than the 11,557 cases recorded during the same week of 2025, an increase of about 0.2%. Compared with week 43 of 2024, when courts recorded 10,148 filings, the current total was 1,427 cases higher, or approximately 14.1%. Chapter 13 increased from 4,007 cases in 2025 to 4,169 in 2026, while Chapter 11 rose from 117 to 165. Chapter 7 moved the other way, falling from 7,428 cases in 2025 to 7,238 this year. More broadly, the 514,840 filings accumulated through week 43 are 10.5% above 2025 and 22.9% above 2024 at the same point of the year.
  7. Using a rounded United States population benchmark of about 342 million, week 43’s 11,575 filings equal approximately 33.8 filings per million residents. Chapter 7 contributed about 21.2 filings per million, while Chapter 13 accounted for roughly 12.2 per million. Chapter 11 contributed about 0.5 per million, and the 3 Chapter 12 cases represented less than 0.1 per million. Week 42’s 10,777 filings equated to approximately 31.5 per million, meaning the national rate increased by roughly 2.3 filings per million in one week. The population-adjusted figures therefore reflect the same 7.4% rebound seen in the overall weekly filing count.
  8. The broader per-capita trend continues to point upward even though week 43 was almost unchanged from the same week last year. Using the same population benchmark, week 43 of 2025’s 11,557 filings equal about 33.8 filings per million, while week 43 of 2024’s 10,148 cases equal roughly 29.7 per million. On a year-to-date basis, the 2026 weekly average of 11,973 filings works out to about 35.0 filings per million residents. That compares with approximately 31.7 per million in 2025 and 28.5 per million in 2024. The progression from 28.5 to 31.7 to 35.0 filings per million shows that bankruptcy activity has continued rising over the past three years after adjusting for population.
  9. Through week 43, the 514,840 filings recorded in 2026 translate to an average of approximately 11,973 cases per week. If that pace continues for the remaining 9 weeks, the year would finish with roughly 622,597 filings. Using the recent four-week average of 12,145 instead would produce a slightly higher estimate of about 624,145 cases. A more conservative scenario in which filings stay at week 43’s 11,575 level would produce approximately 619,015 filings for the year. Those scenarios would place 2026 roughly 10.0% to 10.9% above the 562,656 filings recorded during all of 2025.
  10. Annual bankruptcy filings increased from 378,337 in 2022 to 445,209 in 2023, 503,793 in 2024, and 562,656 in 2025. Those increases represented annual growth of approximately 17.7%, 13.2%, and 11.7%, showing continued expansion even as the pace gradually slowed. A central 2026 projection of about 622,597 filings would represent another increase of roughly 10.7% over 2025. If annual growth then moderated to around 7%, filings would reach approximately 666,179 in 2027 and 712,811 in 2028. The data therefore support continued growth after 2025, while the movement from 10,777 filings in week 42 to 11,575 in week 43 shows that the longer-term increase will continue to include normal week-to-week variation.

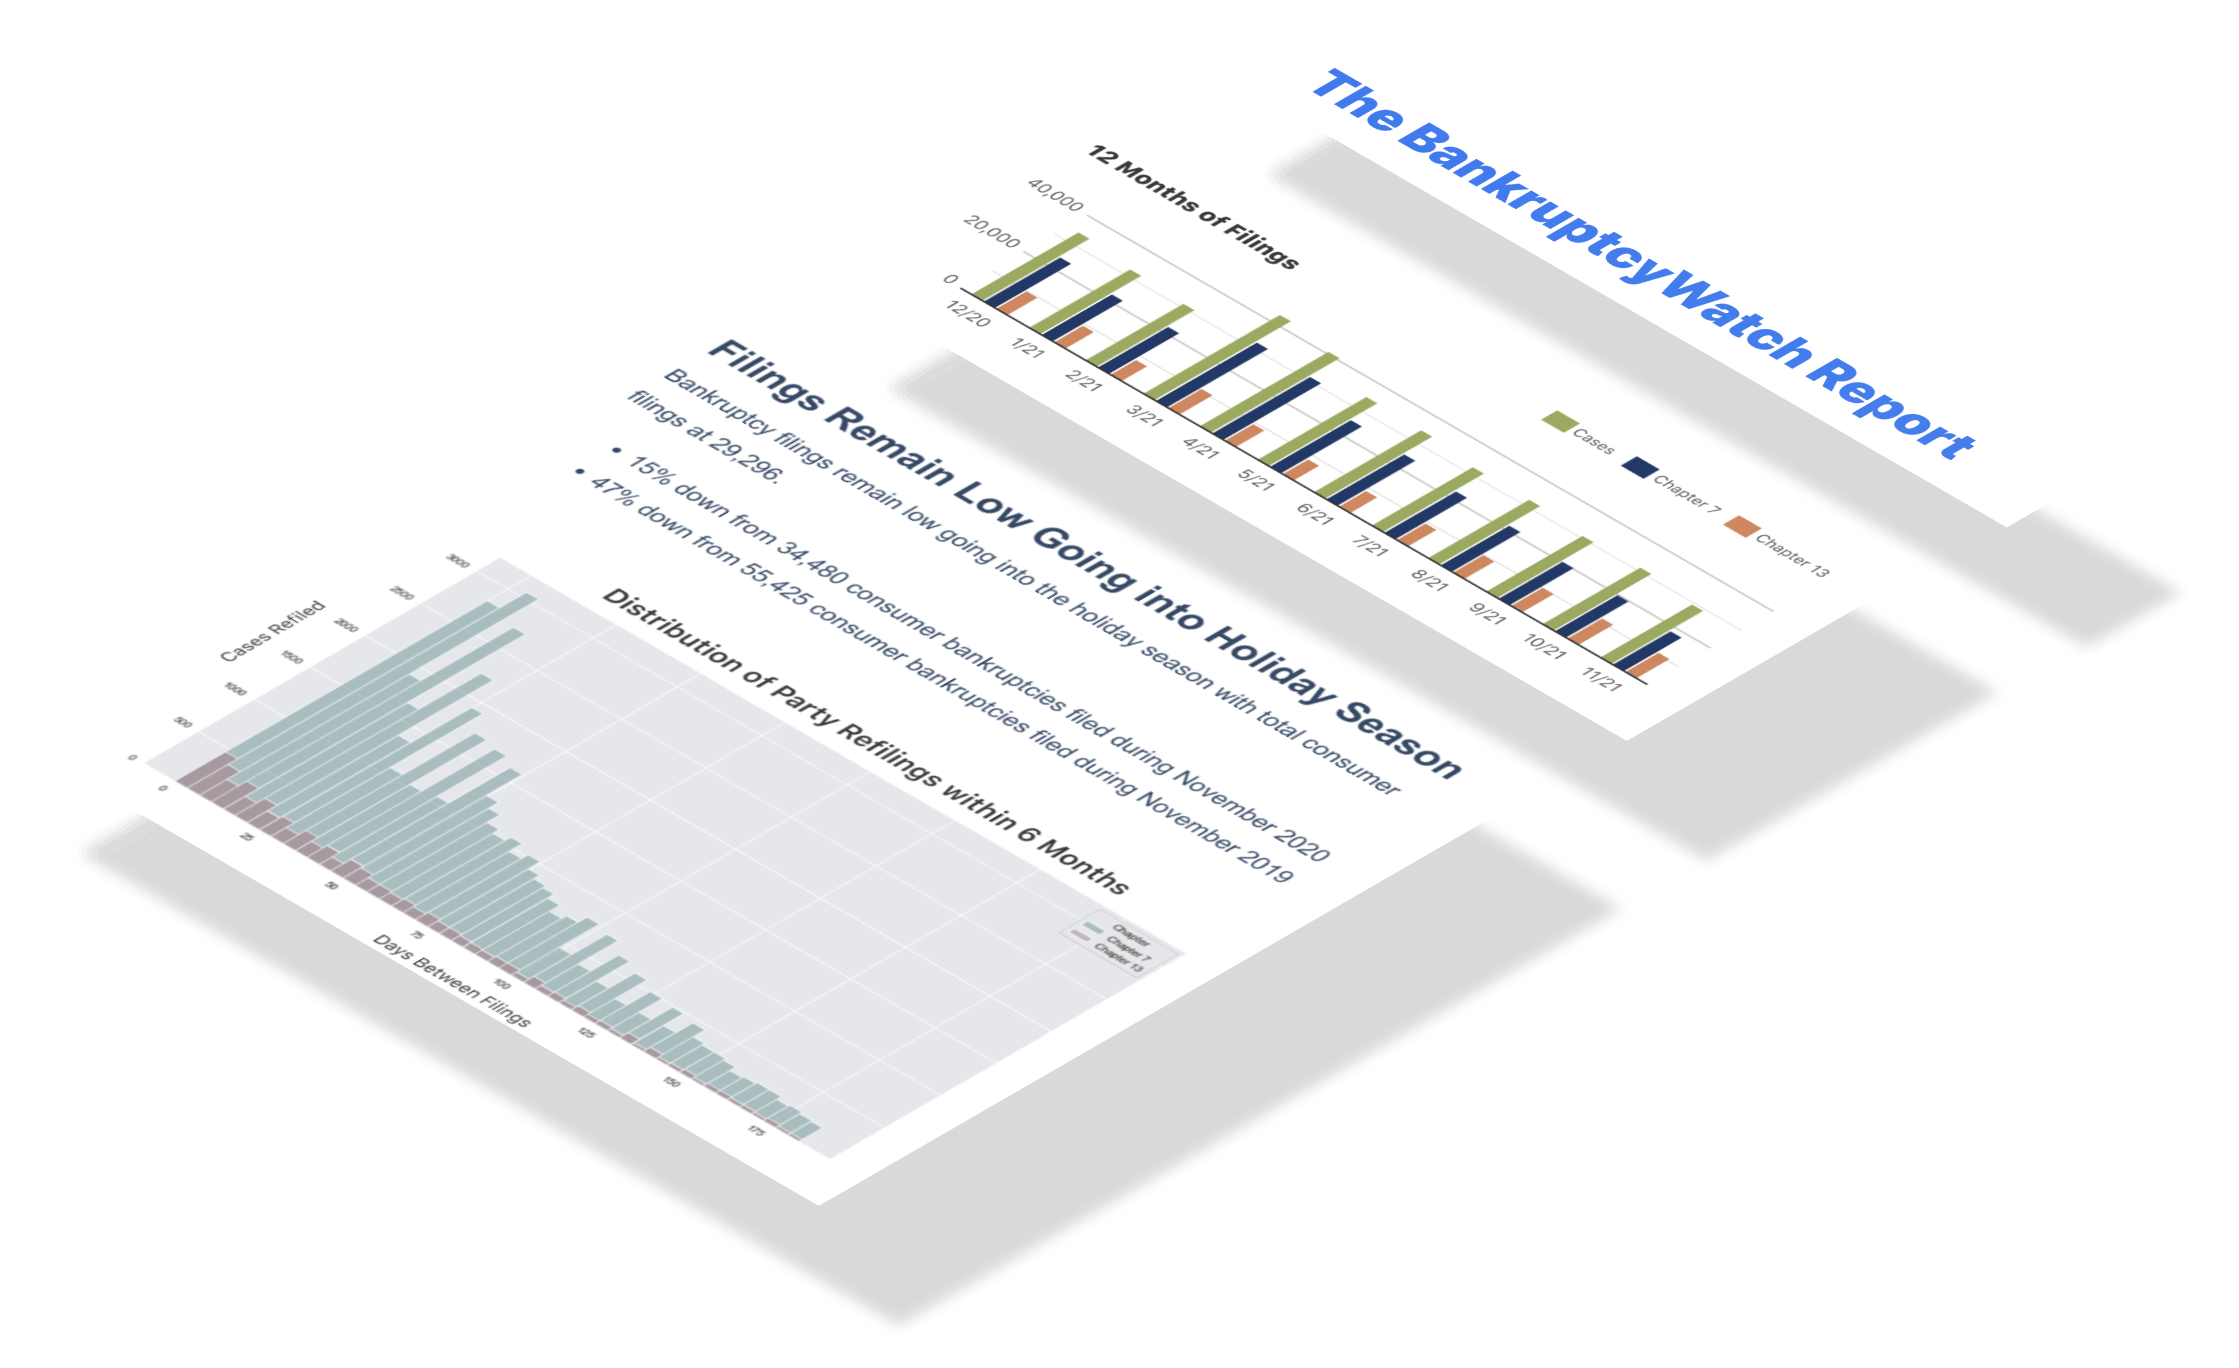
Subscribe to Our Monthly Data-Driven BankruptcyWatch Report

Loading...
newsletter